The claim.me Overview - Detailed claim.me Analytics
The claim.me overview gives you a new level of transparency into your parcel claim performance — all in one place.
With the claim.me overview you can:
Maintain a clear overview of claim rates, acceptance rates, claim outcomes and more
Be able to deep-dive into specific rejection reasons
Go into carrier-specific numbers to monitor performance
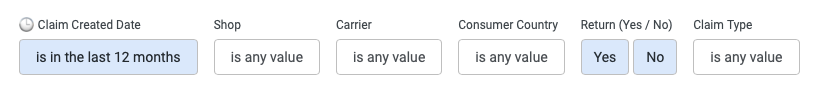
Powerful Filters for Precise Insights
The claim.me Overview includes a flexible set of filters that let you tailor the data to your exact needs. Adjust the view to answer specific questions, analyse trends, or focus on a particular carrier, destination, claim type, or time period — all with just a few clicks.
All filters apply across every tile in the dashboard, with the exception of tiles dedicated to claim rate, which remain fixed to ensure consistent calculation and comparability.
Overview — Your High-Level Claim Performance at a Glance
The Overview section gives you a clear, aggregated snapshot of your claim performance across key metrics
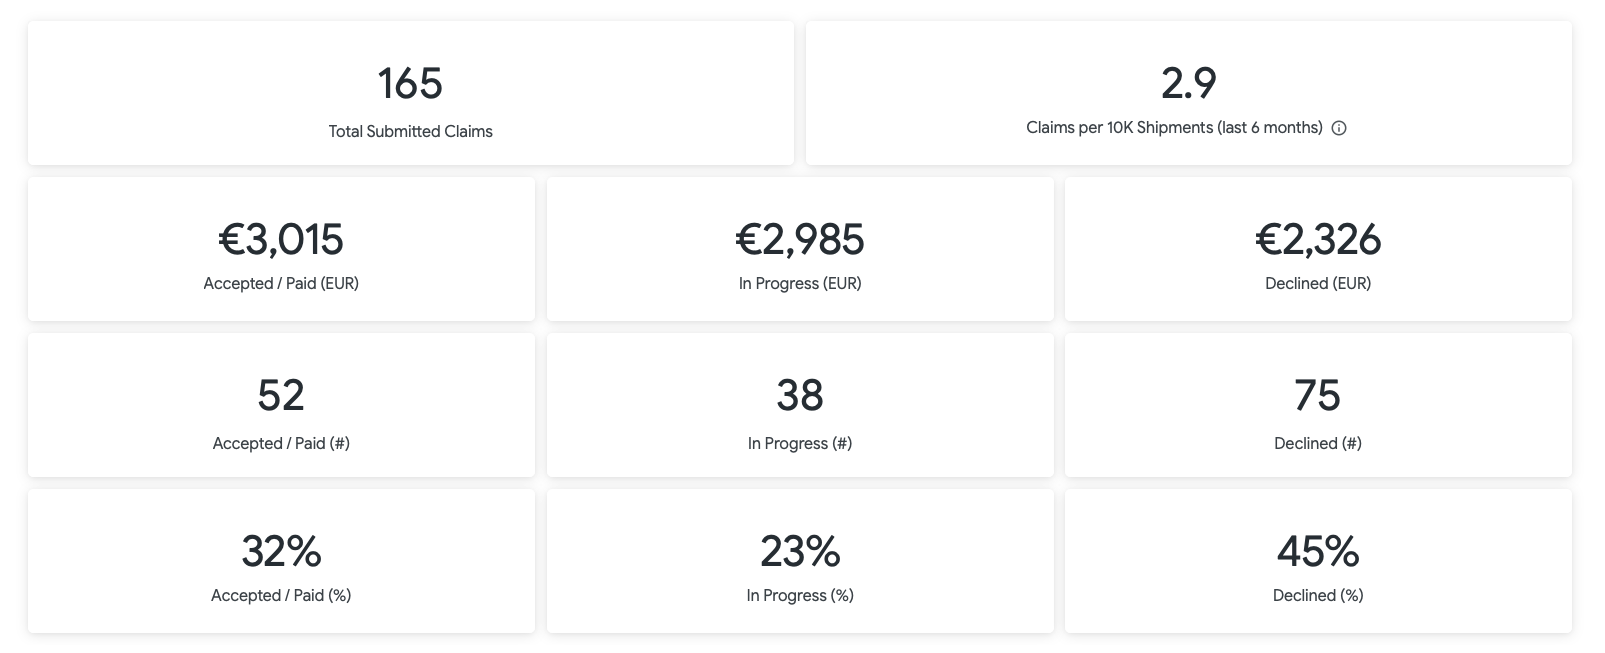
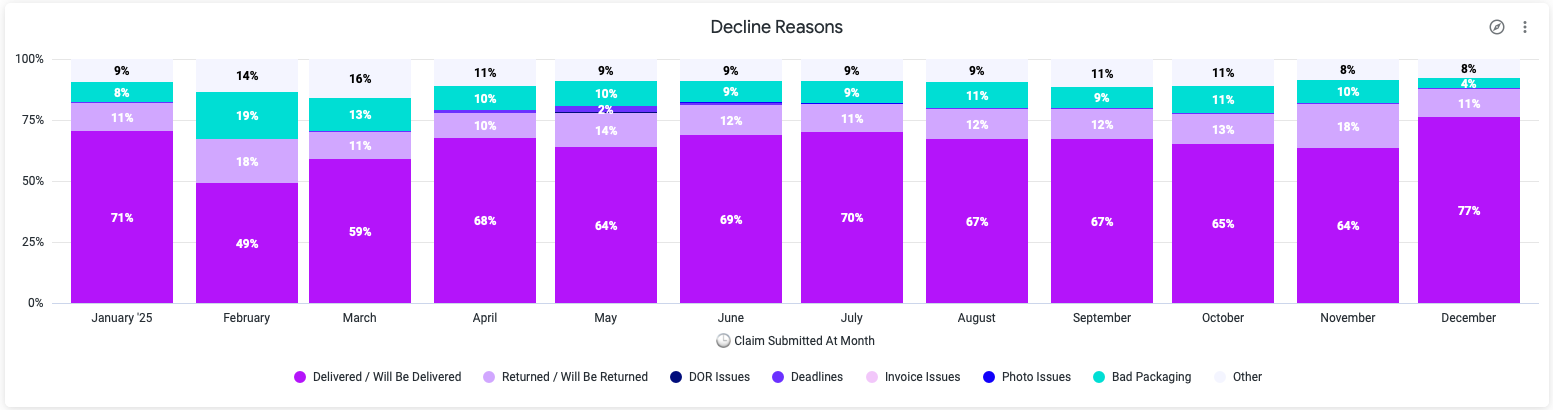
Outcomes — Monthly Breakdown of Claim Results
The Outcomes view shows how your claims progress over time, giving you a clear monthly breakdown of:
Accepted claims: Claims that have been approved and paid.
In-progress claims: Claims still under review with the carrier.
Declined claims: Claims that were rejected.
Decline reasons: A detailed analysis of why claims were declined, harmonised into 8 simple categories
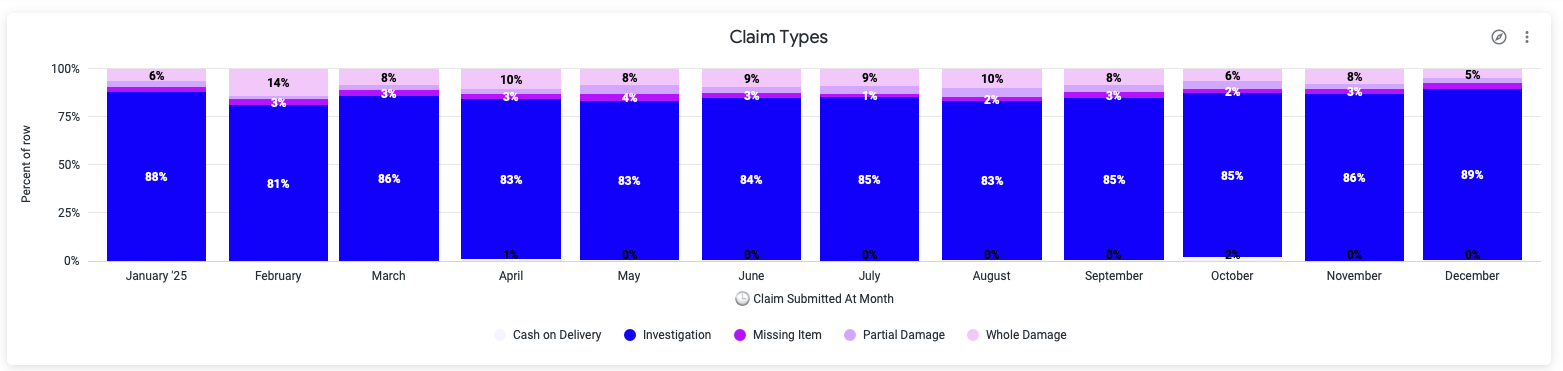
Claim Types & Carriers — Monthly Insight Across Claim Categories and Carrier Performance
The Claim Types & Carriers view provides a detailed monthly breakdown across several important dimensions, helping you understand what types of claims you are submitting and how each carrier is performing.
This section includes:
Claim types: A monthly distribution of investigation, missing item, partial damage, whole damage and cash-on-delivery claims.
Outstanding draft claims: An overview of claims that have been started but not yet submitted and likely waiting on the consumer to either sign the DOR or upload the necessary photos.
Claims per carrier: See how many claims each carrier generates.
Claims per 10k shipments per carrier: A normalised comparison that shows the relative claim rate across carriers, making performance differences easy to spot.
Reimbursement per carrier: Understand the total amount reimbursed per carrier.